AI-powered executive reports from your spreadsheets
Upload a spreadsheet and receive a structured executive report — complete with AI-generated insights, trend analysis, key drivers and clear operational next steps.
Charts are easy. Writing the executive narrative is not.
Introspect uses AI to interpret your data and generate structured, presentation-ready analysis — not just visualizations.
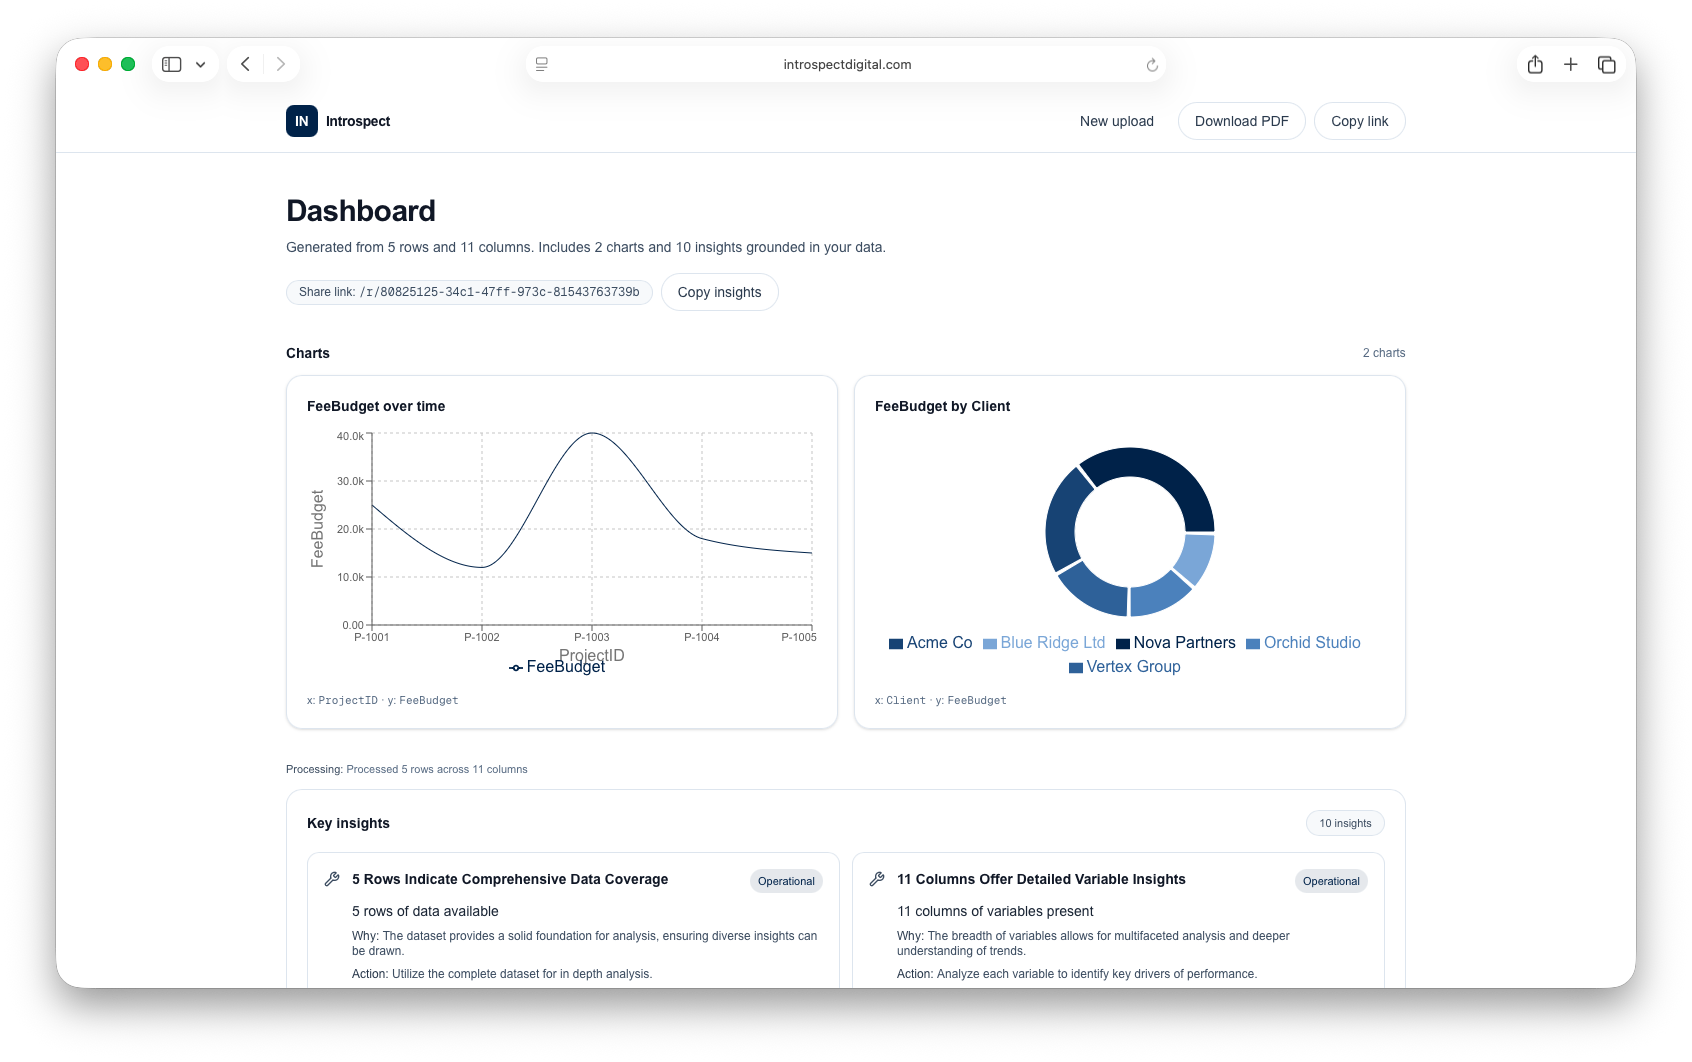
What you get from one upload
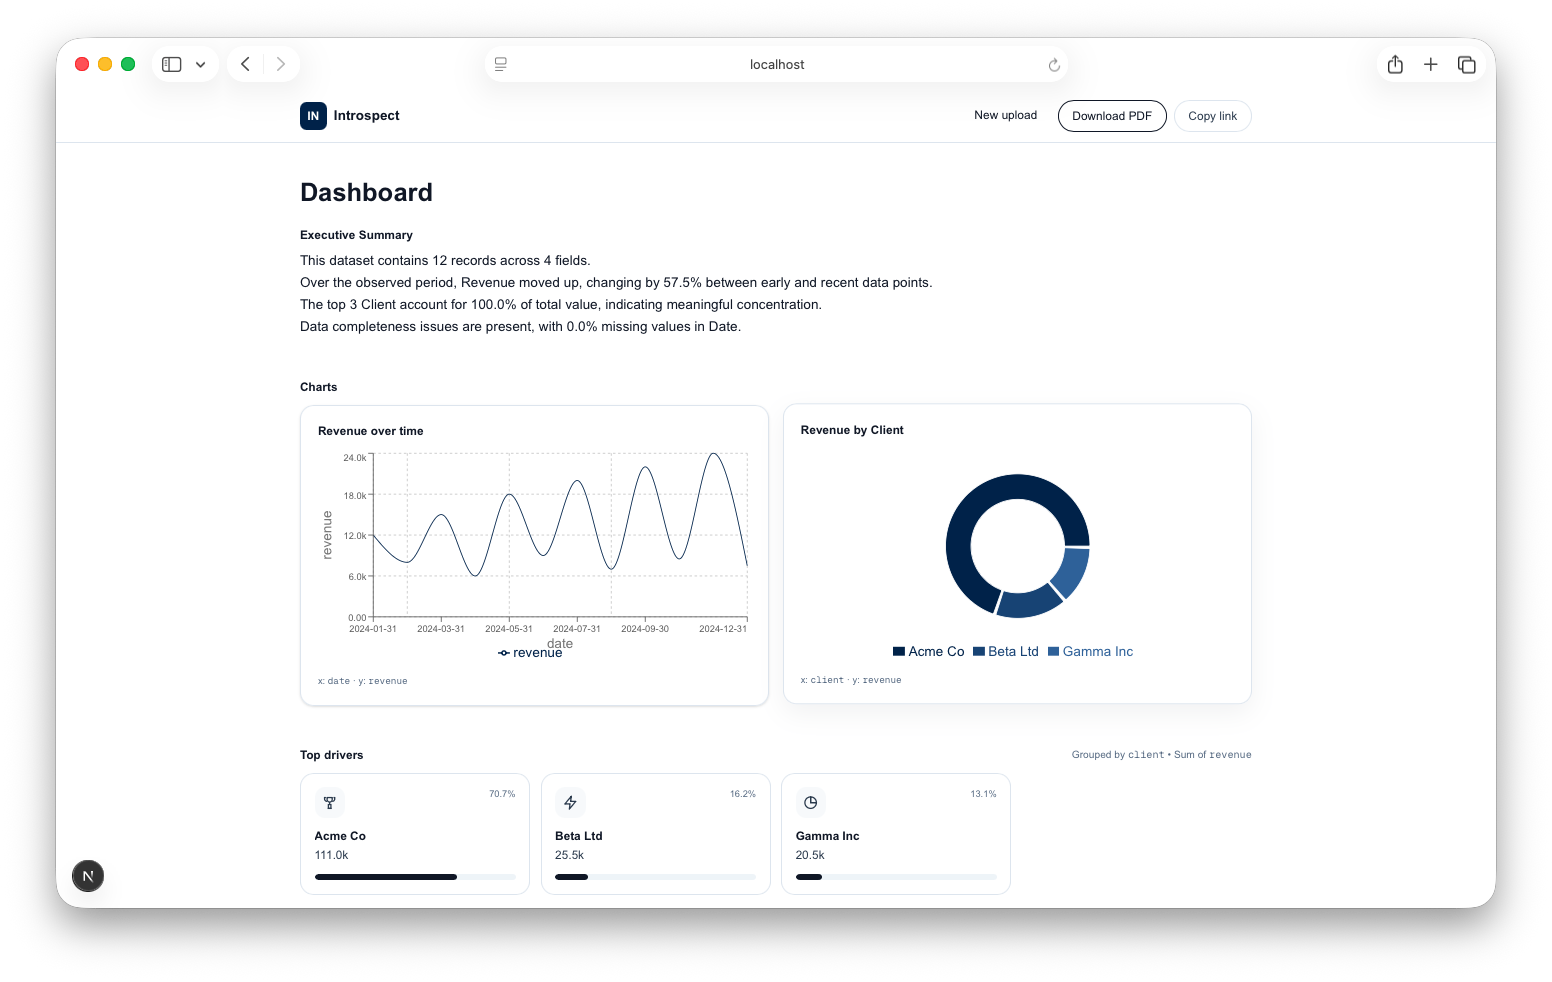
Multi-paragraph narrative written in confident operator tone.
Clear visual explanation of performance drivers.
Surface concentration, exposure and impact areas.
Up to 10 data-backed conclusions generated automatically.
Structural analysis beyond surface-level metrics.
Specific operational recommendations tied to your data.
Built for consultants, founders and operators
Consultant Client Reporting
Upload client exports and instantly generate structured executive updates — powered by AI interpretation.
What you actually receive
Structured, presentation-ready narrative derived from your data.
Data coverage, signal detection and structural overview.
Clear identification of what drives performance.
Specific next steps aligned with findings.
$12 per AI-generated executive report
Generate a free preview. Unlock only if the AI analysis looks right.
Generate Free Preview